
My husband is a huge Philadelphia Phillies fan and is incredibly understanding that I grew up a Boston Red Sox fan. He doesn’t typically forward along to me the articles he reads online about baseball, but this particular article not only was about the Red Sox, but also about crocheting!
It turns out that the Boston Red Sox have a left-handed pitcher named Garrett Crochet. And this season, there is a Red Sox fan that is crocheting a red-and-white sweater on the days that Crochet starts (see this MBL article). Although I have seen others knit and crochet at a few games in the past, I hadn’t done so myself. My husband and I started joking that I could crochet at the next Phillies game we attend – and that it wouldn’t be just crocheting any object, but a data visualization based on the game! Our laughter at the idea then turned into a serious design project. My husband named it “Batter Up!“

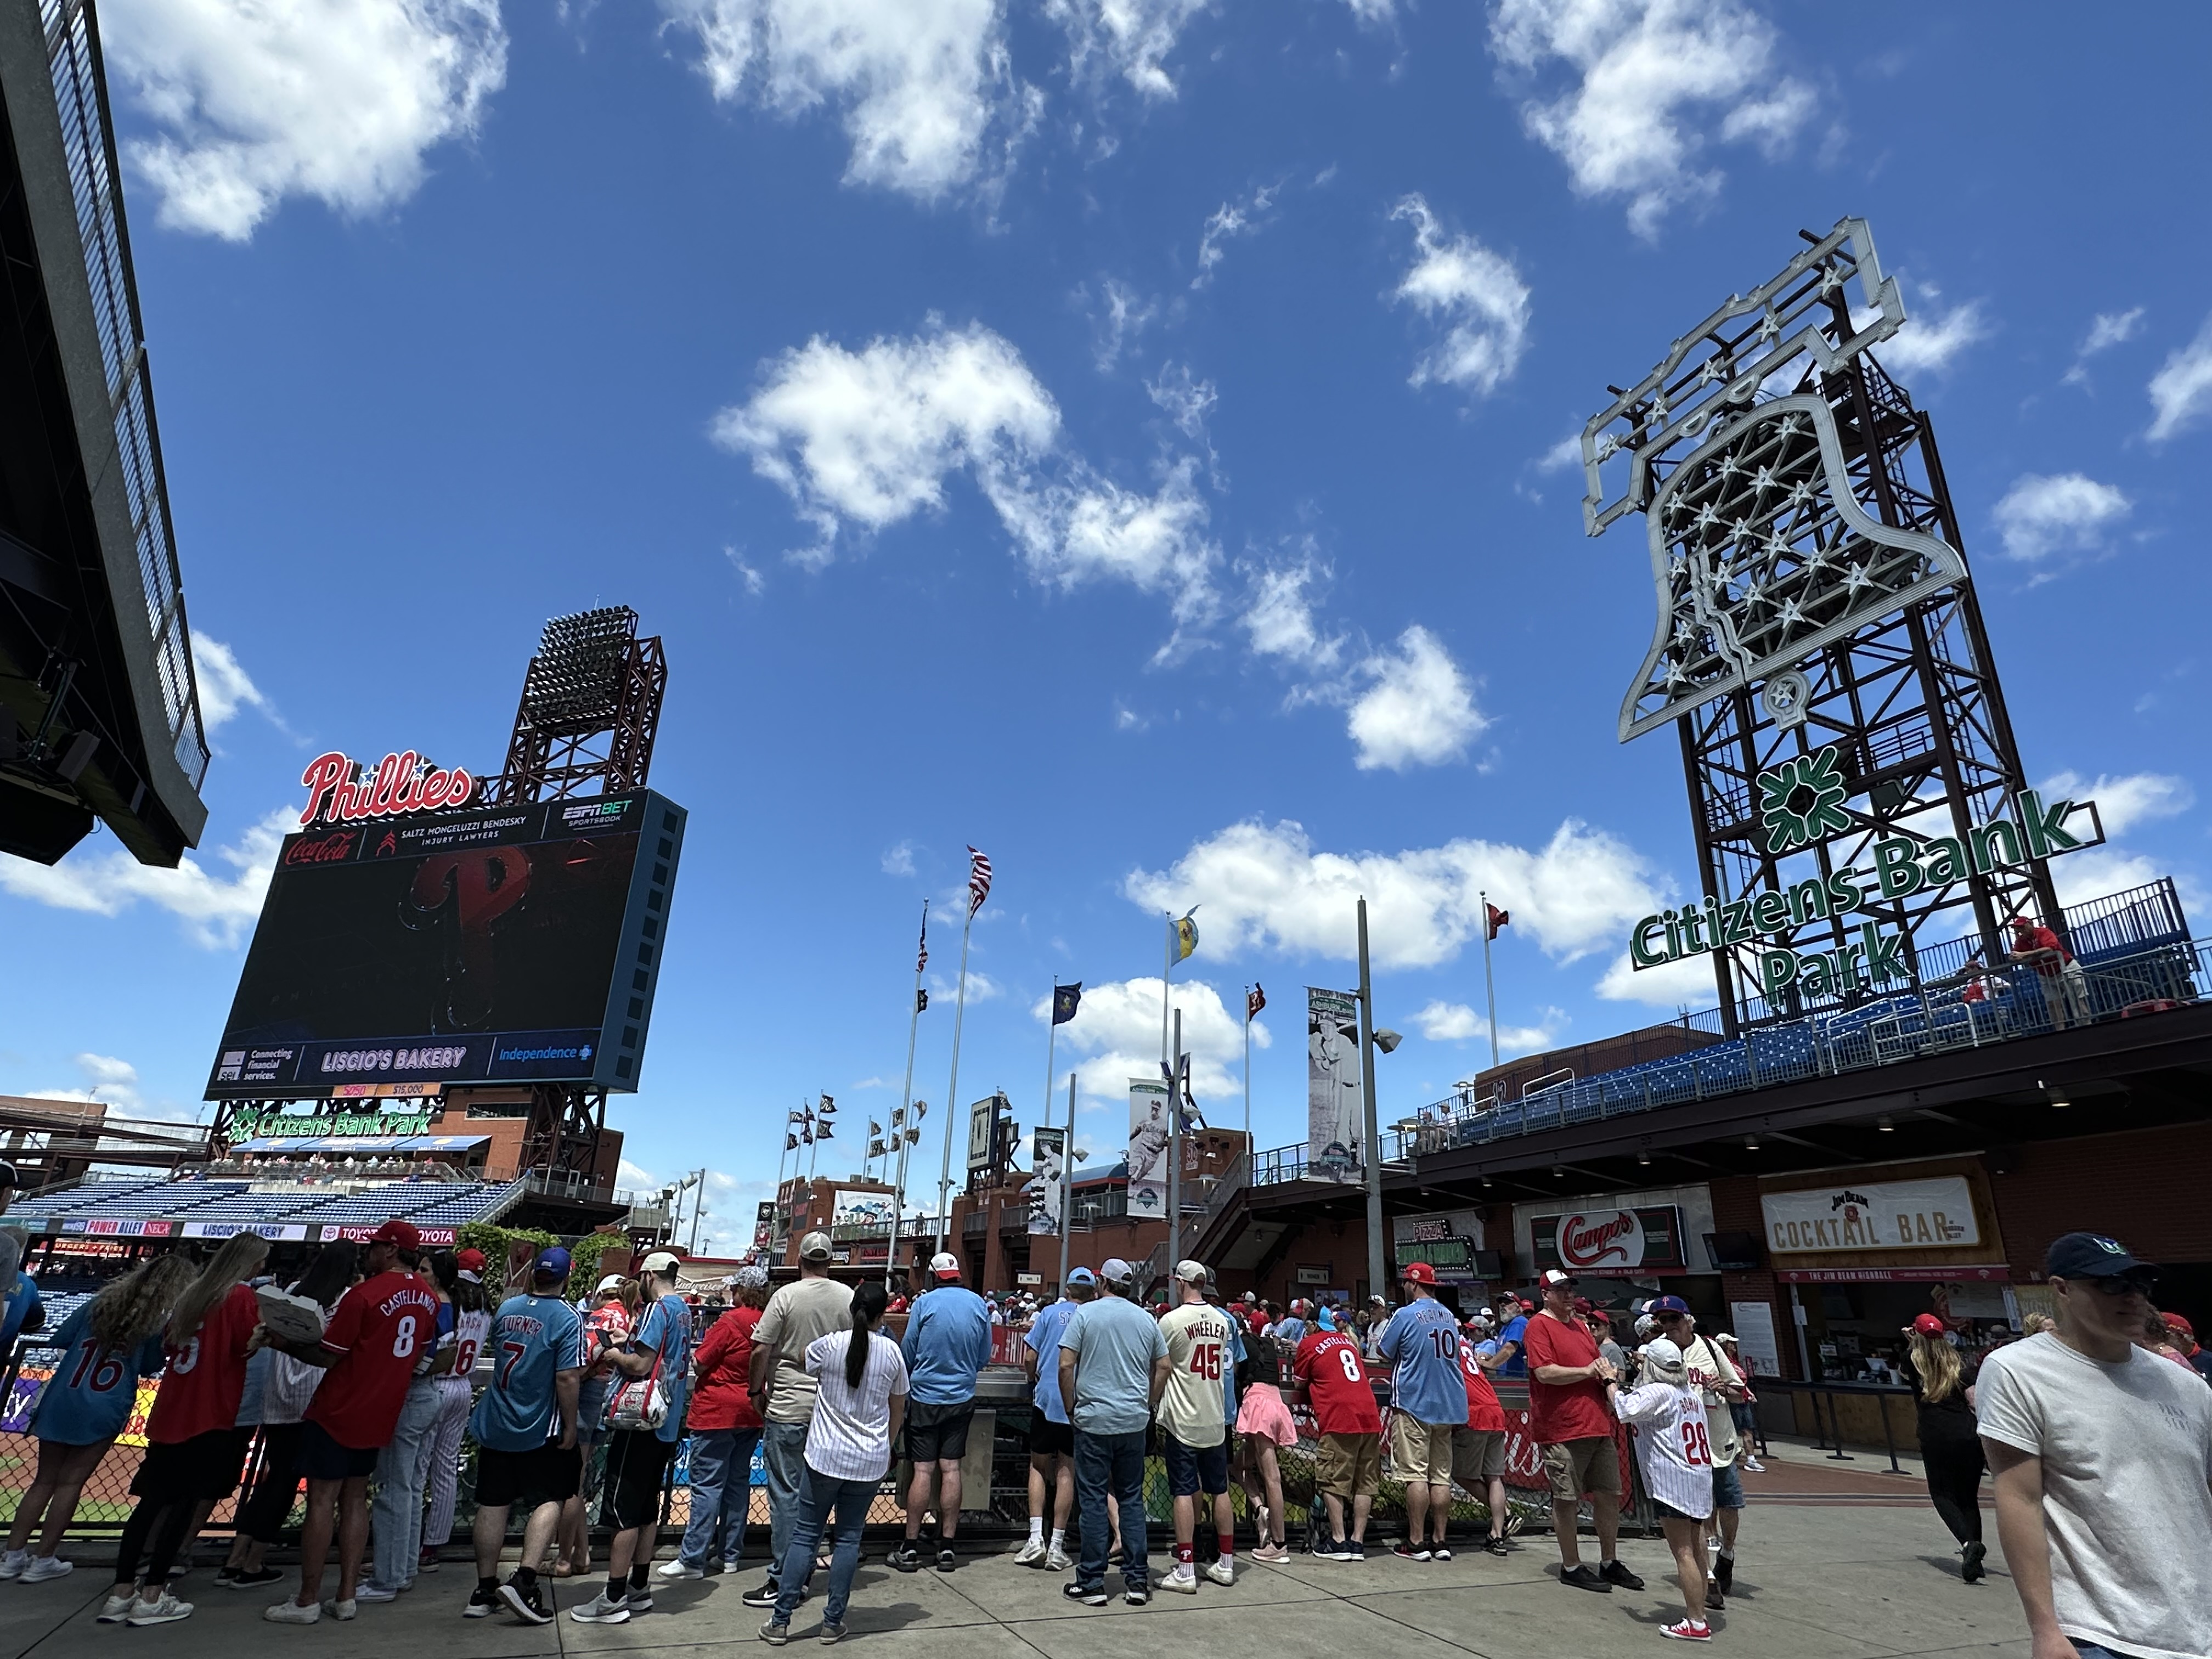
Our plan was put into place when we attended the Phillies game on Sunday, May 18, when the Pittsburgh Pirates were in town. The idea was that I would make something similar to a scarf, something rectangular in shape. I would crochet a row each time a batter came up to home plate.
I would use red yarn to represent a Phillies player (official team colors red/white/blue) and gold yarn to represent someone from the Pirates (official team colors are gold/black/white). I went through my yarn collection and found some Lion Brand Yarn from their Heartland Yarn collection I purchased back in 2017. I picked the Redwood [113] yarn for the Phillies and the Yellowstone [158] yarn for the Pirates. I grabbed a crochet hook size I (5.25 mm), and I was ready to stitch!
Fast-forward to Game Day! I was excited about doing this project, but nervous about a few things. For example, I wasn’t sure if my metal crochet hook would get through security at the gate, and I definitely was unclear if my TSA-approved folding scissors would make it. But all of my items (including the backup plastic crochet hook I brought with me) were in my see-through plastic stadium-approved bag, and there were no issues going through security (phew!).

Next item on my mind – how would I make sure the balls of yarn wouldn’t end up rolling under the seats in front of me as I crocheted? Stadium seats are made for sitting, not necessarily working on a crafting project that involves switching between two different yarns. Fortunately, after I finished eating my lunch (it was a 1:30PM game), I used the cardboard box that carried my food to now hold my yarn and scissors. The yarn never left the box (another sigh of relief!).
Finally – would I be able to keep up with the stitching during the game? We decided on just recording the number of batters for each team by inning for this data visualization, as that is easy for me to keep track of, and enough time while a batter is at home plate for me to crochet a complete row – or so I thought! With the pitching clock in play, the time between pitches is so much faster than prior games in prior years. Fortunately, my husband brings his scorebook to every game and was tracking the game statistics, so if I fell behind, we would at least have the numbers for me to still work with (and ESPN also has a record of play-by-play statistics).
I stitched the first three gold rows before the game officially started, as I knew there would be at least three batters in the first half of the first inning. But it didn’t take long for me to fall behind in keeping up with the number of batters in the innings. Again, fortunately, we had the scoring book for me to keep on catching up! I was a half-inning behind for most of the first half of the game, then I suddenly found myself stitching an entire inning behind.

But then, I raised the white flag on being able to complete this project during the game when the sixth inning approached. My husband ran up to the concessions between the fifth and sixth innings to grab me some popcorn. Unfortunately, there was a medical emergency in my section at the start of the sixth inning, and no one was able to use the stairs to leave or reenter our section. My priority no longer became the crocheting but getting the scoring documented for my husband (and, selfishly, for me for my project!). The stairs could not be accessed for the entire inning. Once my husband was able to get back to his seat, I still crocheted, but just focused on making progress instead of trying to finish.
After we got home, I was able to complete the project! Here’s my data visualization showing the number of batters for each team during the Phillies/Pirates game on May 18, 2025:

Just by looking at this piece, one can see that there were several innings that were “3 and out” for each team! No team ever had more than 5 batters in an inning, which is why the stripes look so similar in height/thickness.
In addition to having a fun data visualization from the game, it is important to note that this game was the MLB debut of Phillies starting pitcher Mick Abel. Abel pitched nine strikeouts over six scoreless innings, tying Curt Simmons (1947) for the most strikeouts in a Phillies pitcher MLB debut since at least 1901. He allowed five hits and no walks (more stats in this MLB article). The final score of the game? 1-0, with the victory going to the Phillies.
This game was not just a win for the Phillies for Mick Abel – it was a win for me, creating my first baseball data visualization! I don’t know if I’ll attempt to stitch at a game again in the future, but this was a fun project and I do look forward to additional baseball data visualizations in my future.

Laura,
What a cool project. I’m glad you were able to complete the scarf after all the chaos.
Let’s schedule a lunch soon.
Karen C. Theveny
Assistant Teacher Professor, Communications
Mentor/Professor—Lion’s Eye Student Newspaper
Vairo 125
Penn State Brandywine
Happiness is contagious. Spread happy!
LikeLike
[…] This work is my second baseball-themed piece. My first attempt was to crochet at a baseball game the number of batters that came up to bat during each inning for each team. I knew this would be easy data to track, so I brought my yarn to a Philadelphia Phillies game (red for the Phillies, gold/yellow for the Pittsburgh Pirates) and started stitching. You can read about the game and the final data visualization at my post Data Viz crochet – Batter Up! […]
LikeLike