
I was invited to speak at the University of Nebraska’s Data Storytelling Workshop & Data Art Jam to share how I have incorporated data into my quilts. This was an opportunity to showcase some of the quilts I created from my time at sea on JOIDES Resolution (Taking the Temperature and What Goes Up, Must Come Down), including my BTAA award-winning Blue Skies and Cloud Cover JR quilt from Love Data Week 2024!
As I was going to be in a space filled with communicators, artists, scientists, and more, I decided to generate a new data visualization quilt in honor of the workshop. As I’m from Penn State and the workshop was held at University of Nebraska, the idea for this quilt I’ve titled Versus came to me pretty quickly!
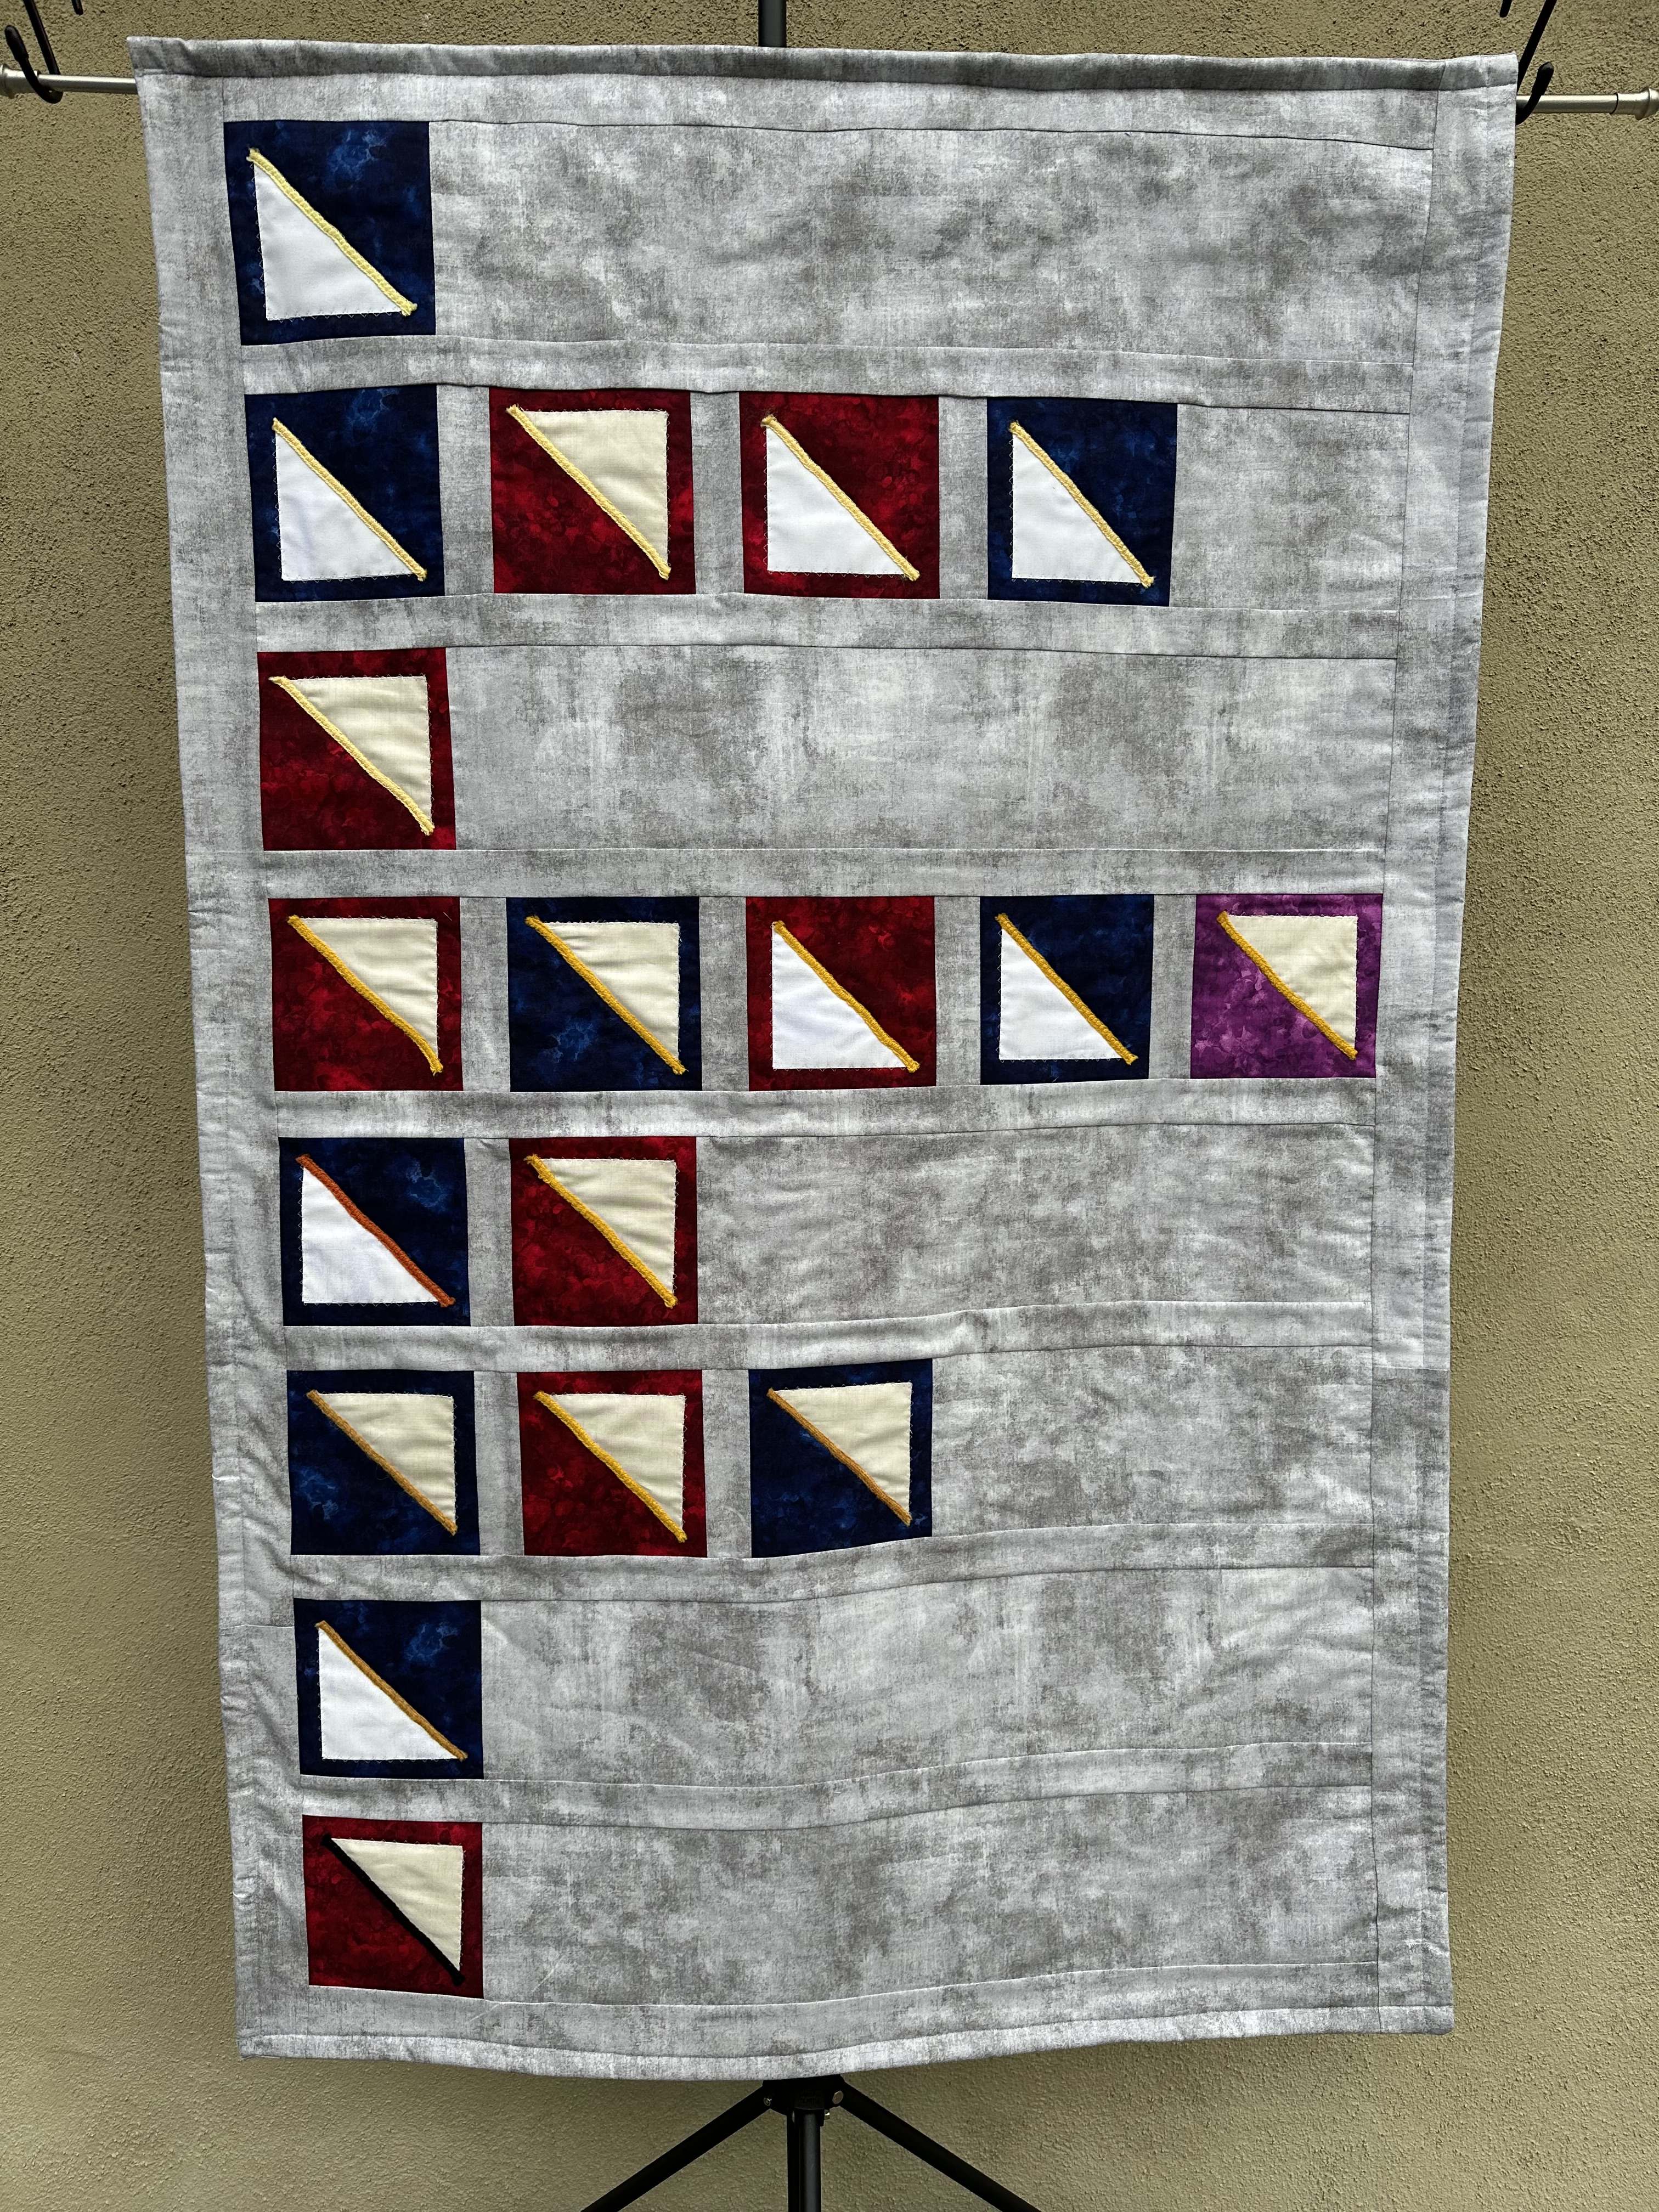
This hanging quilt is a data visualization that captures a snapshot in college football history of all games played between the University of Nebraska and Penn State University. Each square represents one of the 18 games played between these two institutions from 1920 through 2020 (the last time the two institutions went head-to-head).
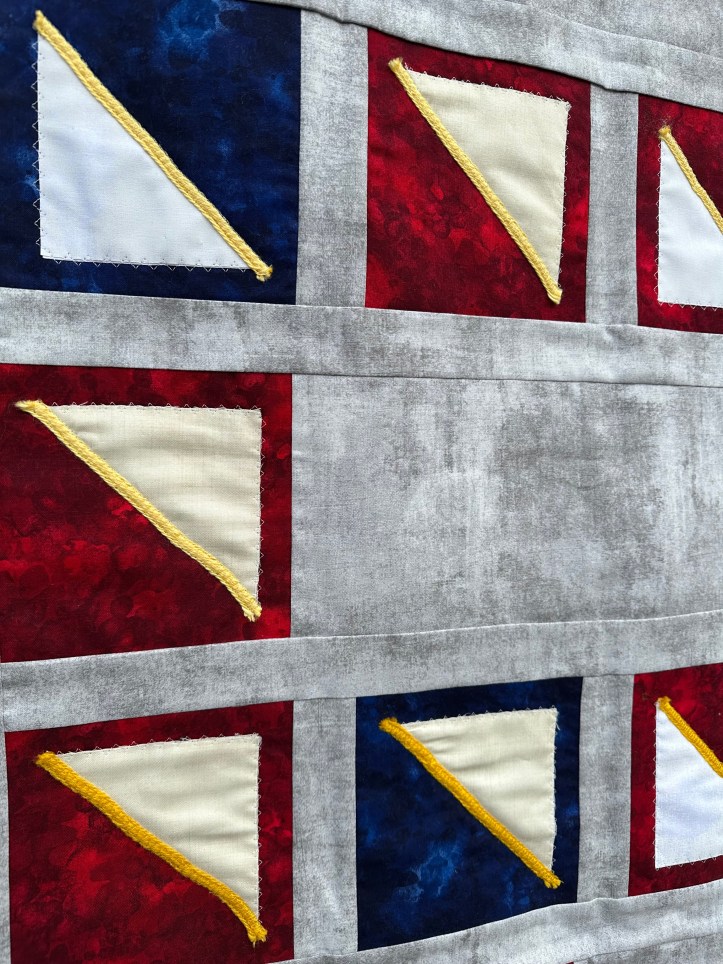
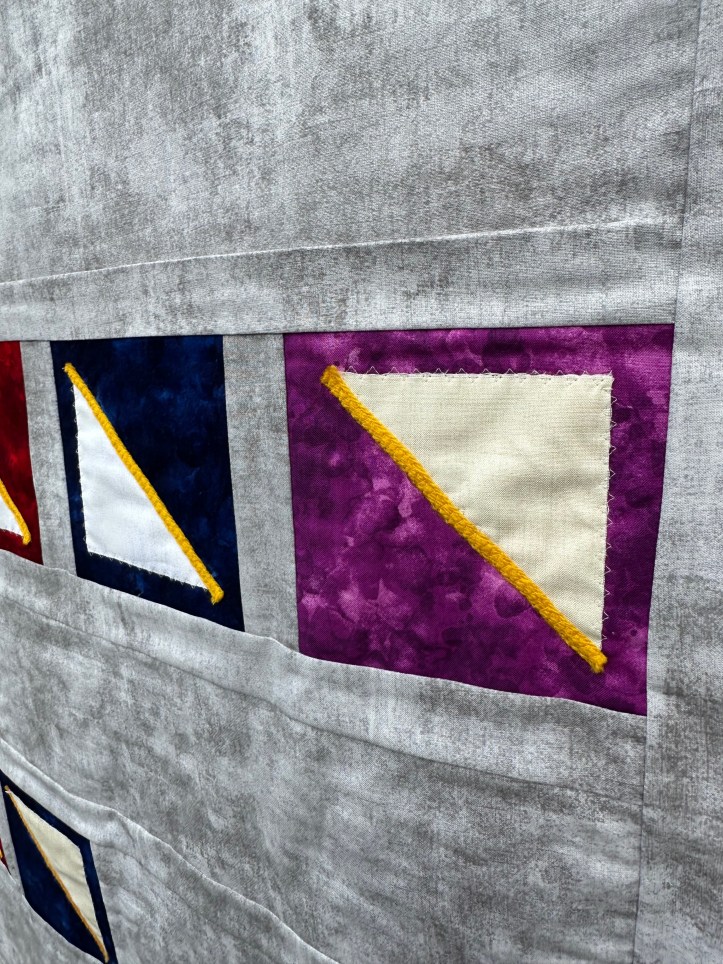
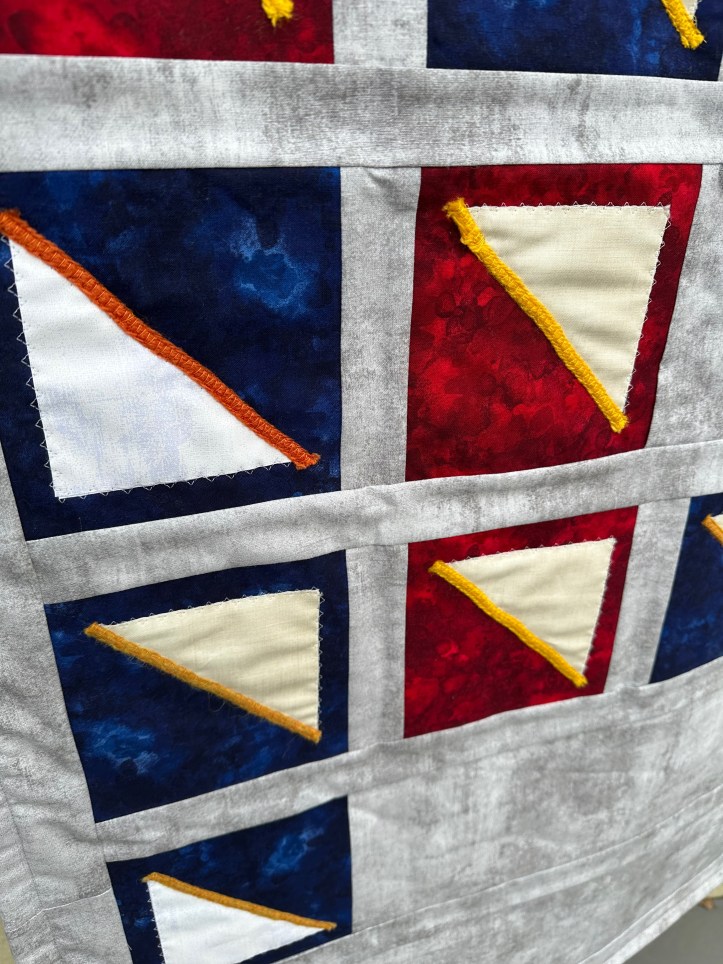
School colors were used with the squares and triangles contained within – scarlet and cream for Nebraska, blue and white for Penn State. The color of each large square represents which institution/stadium was the home team, and the color of the triangle represents the institution that won that match-up. The one square that is purple is for the game held at Giants Stadium (NJ) for the inaugural Kickoff Classic.
The yellow yarn stitched diagonally through each square is a gradation of light-to-dark yellows and oranges representing the lowest number in attendance (0, then 9,000 for the next highest attendance, etc.) to the highest number (110,753). The black yarn represents the absence of any fans in the stadium, and the game was played in 2020.
- Lightest yellow = 1 – 9,999 fans
- Sunshine = 20,000 – 39,999 fans
- Saffron = 70,000 – 89,999 fans
- Yellow Icelandic wool yarn = 90,000 – 109,999 fans
- Carrot/orange = 110,000+ fans

For the rows with more than one square, this reflects when the two universities played in consecutive years.
For people that prefer their data in a table…
Record of University of Nebraska and The Pennsylvania State University football matchups
| Date | Location | Winner | Attendance |
| 11-06-1920 | PA | Penn State | 9,000 |
| 10-15-1949 | PA | Penn State | 23,600 |
| 10-21-1950 | NE | Nebraska | 38,000 |
| 10-13-1951 | NE | Penn State | 39,000 |
| 10-18-1952 | PA | Penn State | 30,000 |
| 09-20-1958 | NE | Nebraska | 26,966 |
| 09-29-1979 | NE | Nebraska | 76,151 |
| 09-27-1980 | PA | Nebraska | 84,585 |
| 09-26-1981 | NE | Penn State | 76,308 |
| 09-25-1982 | PA | Penn State | 85,304 |
| 08-29-1983 | NJ | Nebraska | 71,123 |
| 09-14-2002 | PA | Penn State | 110,753 |
| 09-13-2003 | NE | Nebraska | 78,008 |
| 11-12-2011 | PA | Nebraska | 107,903 |
| 11-10-2012 | NE | Nebraska | 85,527 |
| 11-23-2013 | PA | Nebraska | 98,517 |
| 11-18-2017 | PA | Penn State | 106,722 |
| 11-14-2020 | NE | Nebraska | 0 |
Quilt measures 36 inches wide by 56 inches tall and was completed December 31, 2024. All of the fabric for the front and back of the quilt (backing fabric pictured to the right) was purchased at The Crabby Quilter in Annapolis, Maryland.
For fun, I decided to submit this quilt as a faculty/staff entry to the Penn State Love Data Week 2025 contest. I was thrilled to learn that for the second year in a row, one of my quilts was selected as the Penn State winner! However, unlike Love Data Week 2024, I was not selected the Data Viz Champion for all the BTAA this time. But while I was presenting during the Data Viz Celebration of all the winners from all the Big Ten universities, I received some incredibly kind feedback – seems like lots of people are fans of quilting data visualizations!
- So fun!!
- Brilliantly innovative!
- Really interesting way to do data visualization!!
- Love it! #WeAre
- Love how much information is packed into this visualization!
- Love how you brought data to life!
- I feel both cozy and competitive at the same time. It’s such a unique visual experience!
I also created a fun 3-minute video overview of this quilt – check it out!

[…] for this event, challenging everyone to guess what my quilted dataviz represented. Here’s a description of the quilt and a video I generated about […]
LikeLike