
I have generated several data visualizations in quilts – and now, I’m starting to grow my data visualization collection of crocheted pieces. From temperature data to sky color/cloud cover and now sports data, I’m finding fun ways to dig into my existing yarn collection to represent information.
This work is my second baseball-themed piece. My first attempt was to crochet at a baseball game the number of batters that came up to bat during each inning for each team. I knew this would be easy data to track, so I brought my yarn to a Philadelphia Phillies game (red for the Phillies, gold/yellow for the Pittsburgh Pirates) and started stitching. You can read about the game and the final data visualization at my post Data Viz crochet – Batter Up!

Next, my husband and I were off to Boston later in the summer for a family wedding. As I was born in Massachusetts, I’ve been following the Boston Red Sox my entire life, and was more than happy to see that the Red Sox had a home game during the wedding weekend! I brought the red yarn again (this time, the red representing the Red Sox (Lion Brand Yarn Heartland Yarn Collection from 2017 – Redwood) and blue yarn for the visiting team, the Tampa Bay Rays (Heartland Yarn – Glacier Bay). I also grabbed a size L (8.00 mm) crochet hook.

At the last-minute, even though I brought the yarn and crochet hook to Boston, I decided to leave the materials in the hotel and just enjoy the game (it was also Dropkick Murphy bobblehead night, and I knew I’d have to hold on to both giveaways so my husband could focus on scoring the game). The game was amazing – another win for the Red Sox! – and I started the piece in Boston, finishing it the day we arrived back home.

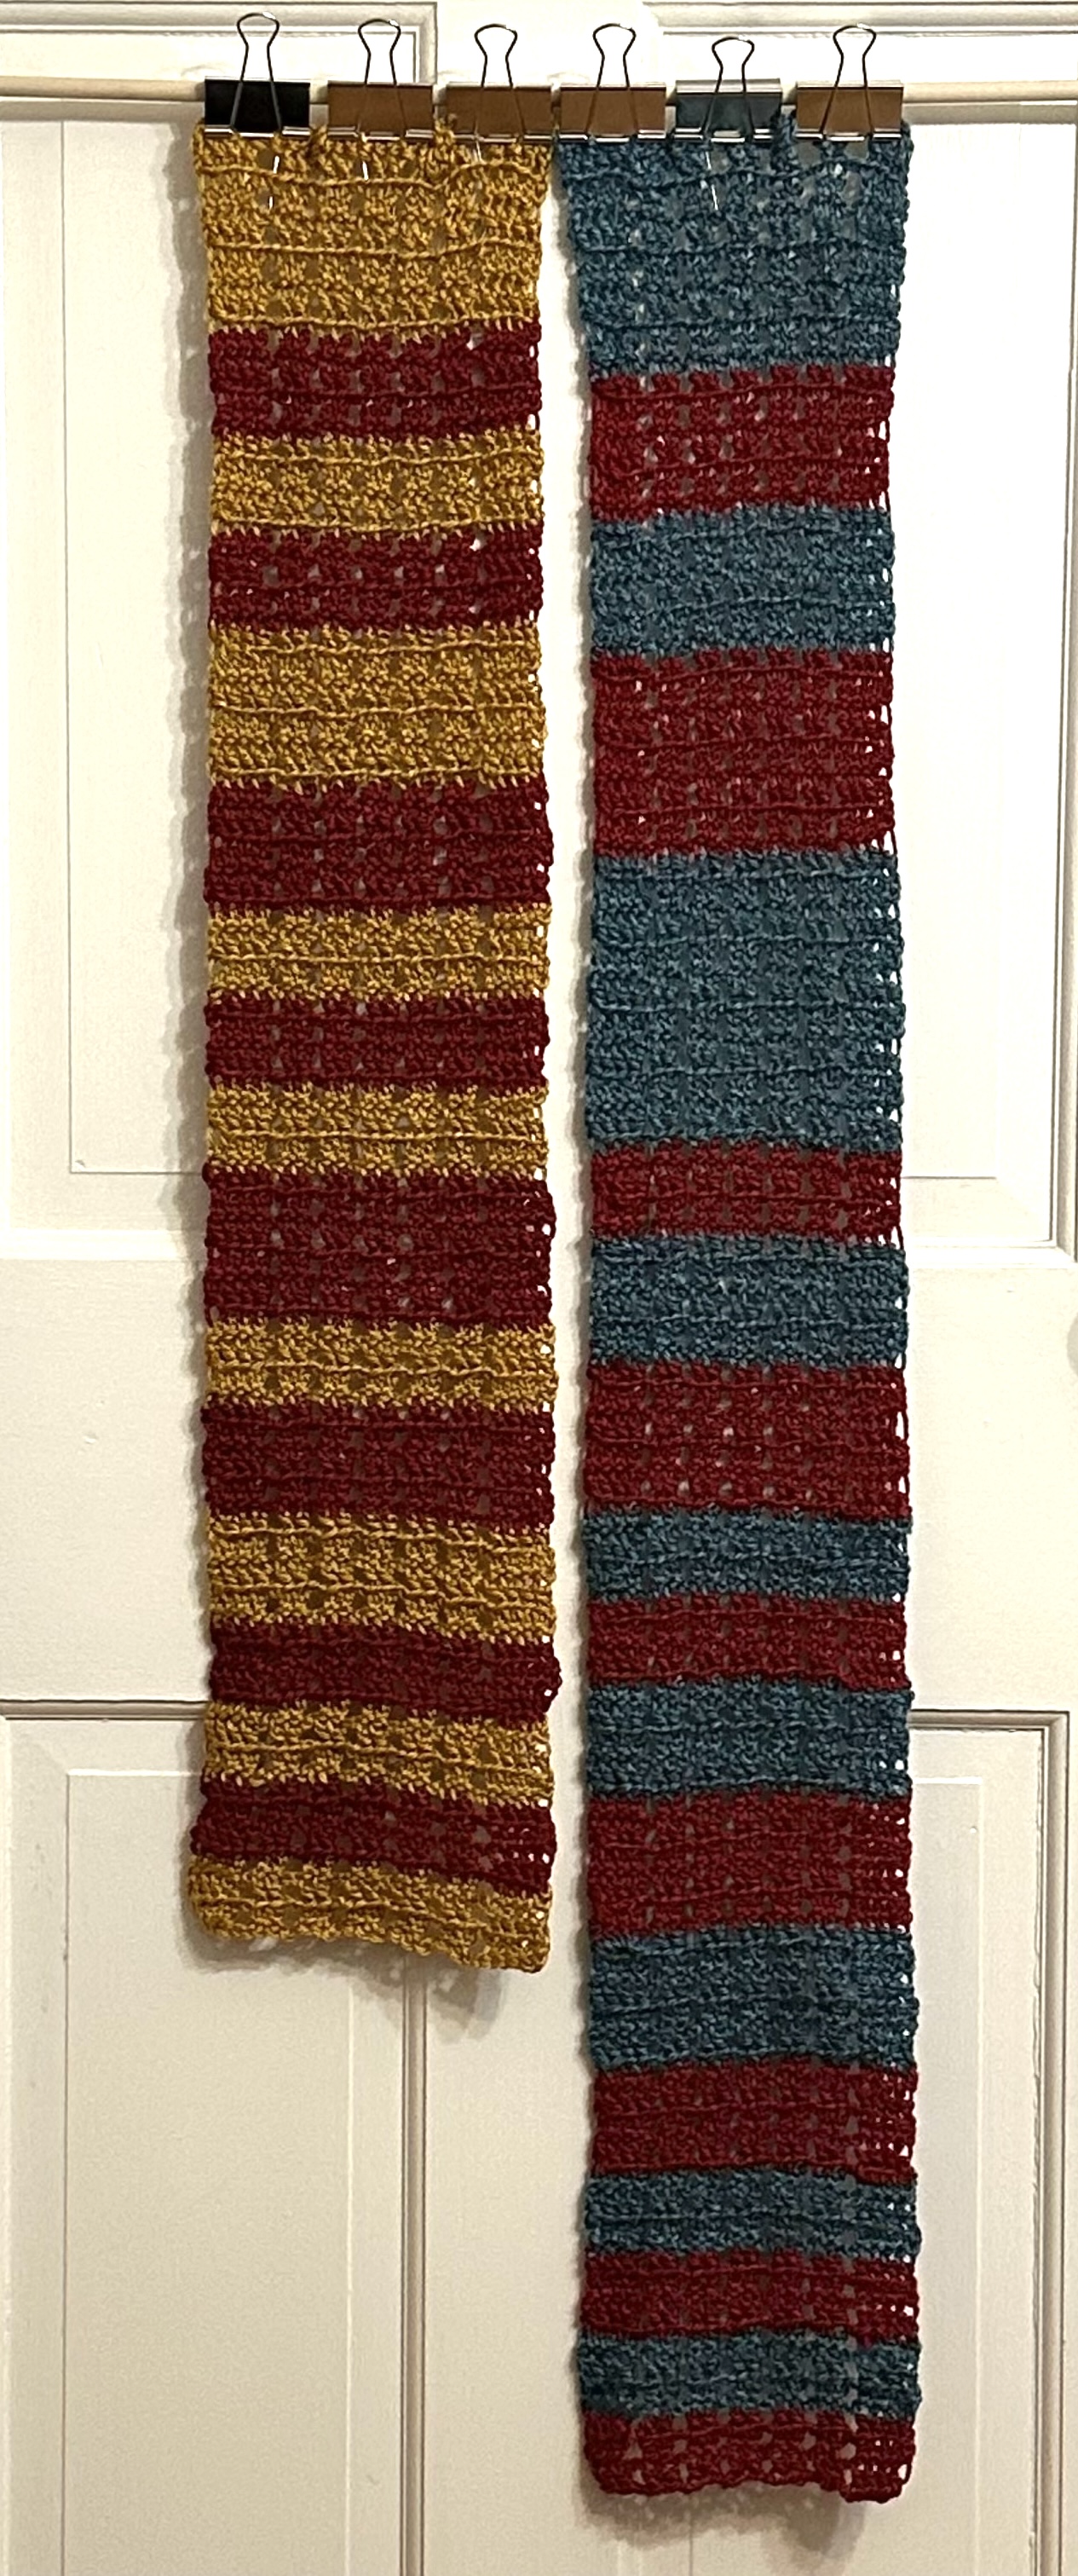
I share here my second Batter Up data visualization (on the right), pictured alongside the first Batter Up (35 inches in length). The ESPN website captures the full play-by-play statistics for the game. Batter Up v2 measures 46 inches in length. I used the same double-crochet stitch for both items. One can see that there were clearly more batters for the Fenway Park game versus the game in Citizens Bank Park – and having attended both games, I can confirm that the game in Boston was longer in duration!
I look forward to having my students explore these pieces in my When Data Meets Design course in the Spring 2026 semester. What can they learn about each game from looking at these crocheted pieces? What information is not contained? And, perhaps more importantly… just because data can be crocheted, does it mean it should be? Hmmm……
