
This is one of the eleven blog posts I authored from my time at sea on NOAA Ship Oscar Dyson. View a complete list of and links to my blog posts.
NOAA Teacher at Sea
Laura Guertin
Aboard NOAA Ship Oscar Dyson
June 10 – June 22, 2023
Mission: 2023 Summer Acoustic-Trawl Survey of Walleye Pollock in the Gulf of Alaska
Geographic Area of Cruise: Islands of Four Mountains area, to Shumagin Islands area
Location (2PM (Alaska Time), June 18): 55o 15.3391′ N, 160o 17.8682′ W
Data from 2PM (Alaska Time), June 18, 2023
Air Temperature: 8.9 oC
Water Temperature (mid-hull): 7.7oC
Wind Speed: 4 knots
Wind Direction: 182 degrees
Course Over Ground (COG): 356 degrees
Speed Over Ground (SOG): 12 knots
Date: June 19, 2023
Acoustic fisheries surveys seek to estimate the abundance and distribution of fish in a particular area of the ocean. In my case, this Summer Survey is looking at walleye pollock in the Gulf of Alaska. How is this accomplished? Well, it’s not through this method:
The Alaska walleye pollock is widely distributed in the North Pacific Ocean with the largest concentrations in the eastern Bering Sea. For this expedition, Oscar Dyson is traveling to specific regions in the Gulf of Alaska and running transects perpendicular to the bathymetry/contours (which are not always perpendicular to the shore) to take measurements using acoustics and targeted trawling to determine the abundance and distribution of walleye pollock which informs stock assessment and management models. For this blog post, let’s focus on how and why we can use acoustics to locate fish.

Our story starts with the fish itself. Alaska walleye pollock have a swim bladder. The swim bladder is an internal organ filled with gas that allows a fish to maintain its buoyancy and stability at depth.
One interesting effect of the swim bladder is that it also functions as a resonating chamber that can produce and receive sound through sonar technology. This connection was first discovered in the 1970s, when low-frequency sound waves in the ocean come in contact with swim bladders and they resonated much like a tuning fork and return a strong echo (see WHOI’s Listening for Telltale Echoes from Fish).
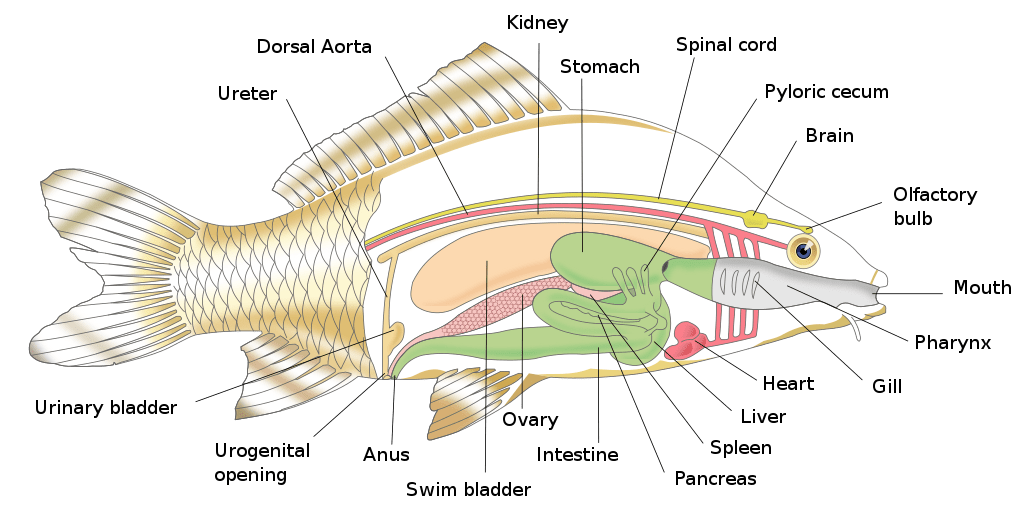
NOAA Fisheries uses echo sounding, which works by emitting vertical pulses of sound (often referred to as pings), and measuring the return strength and recording the time for the signal to leave and then return. Anything having a different density from the surrounding water (in our case – fish, plankton, air bubbles, the seafloor) can return a signal, or “echo”.

The strength or loudness of the echo is affected by how strongly different ocean elements reflect sound and how far away the source of the element is. The seafloor usually makes the strongest echo because it is composed of rock which has a density different than the density of water. In fish, the swim bladder provides a contrast from the water. In addition, each fish species has a unique target strength or amount of sound reflected to the receiver. The size and shape of the swim bladder influence the target strength. There is a different target strength to length relationship for each species of fish – the larger the fish, the greater the strength of the returning echo.
It’s important to note that echo sounders cannot identify fish species, directly or indirectly. The only way we know which fish species is causing a signal is based on trawl catch composition. There is nothing within the acoustic data that lets us identify fish species, even with the catch data. This is a subtle, but important, distinction. Acoustic data, particularly calibrated acoustic data, in tandem with the information from the trawl, definitely allows us to count fish.
Where is the echo sounder on Oscar Dyson? Look at the figure in the next section of this post – it’s a sketch of NOAA Ship Rainier, but the placement of the echo sounder is the same for Dyson. You can see a rectangular “board” that is extended down from the center of the ship. This is called – what else – the center board! Attached to the bottom of the center board are the echo sounders. When lowered, the echo sounders sit at 9 meters below the level of the sea (~4 meters below the bottom hull of the ship).
Did you know… Southern Resident killer whales use their own echolocation clicks to recognize the size and orientation of a Chinook’s swim bladder? Researchers report that the echo structure of the swim bladders from similar length but different species of salmon were different and probably recognizable by foraging killer whales. (reported in Au et al., 2010)
It starts with a calibration

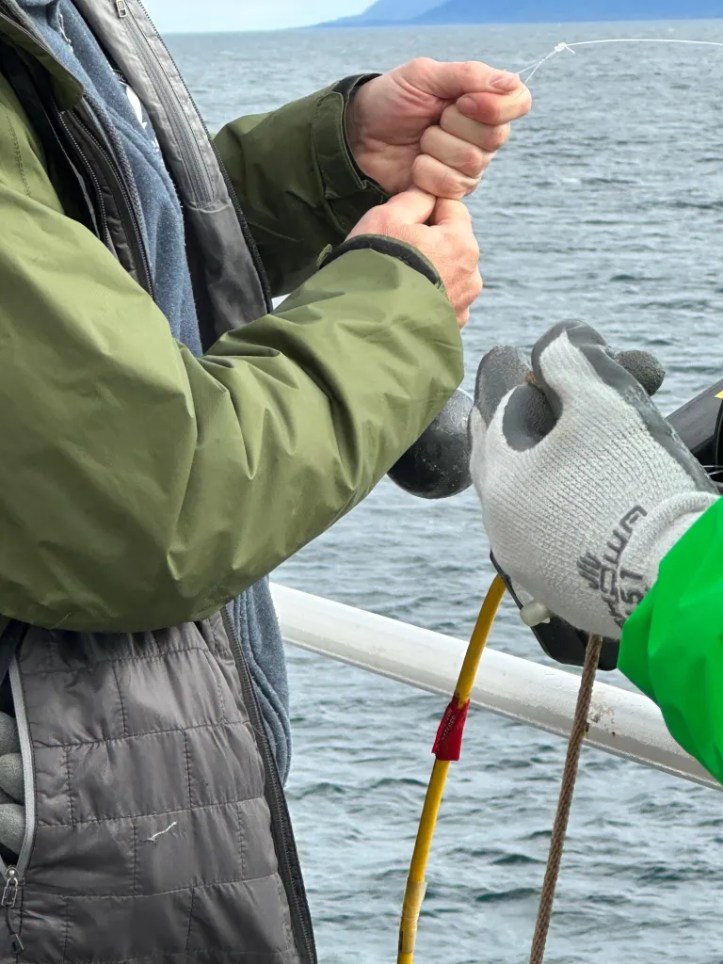
Before we can begin collecting data, we need to calibrate the echo sounder. The calibration involves a standard target (a tungsten carbide sphere) with a known target strength. The calibration needs to be completed in waters that are calm and without significant marine life for the best results.
The sphere is suspended below the ship’s hull using monofilament lines fed through downriggers attached to ship railings. One downrigger is in line with the echo sounder on the starboard side, and the other two on the port side. This creates a triangle that suspends the sphere in the center of the echo sounder’s sound beam. By tightening and loosening the lines, the sphere can be positioned under the center of the sound beam and can also be moved throughout the beam. By doing an equipment calibration at the beginning and end of a survey, we can ensure the accuracy of our data.


For further exploration
NOAA Ocean Service – Ocean Facts – How do scientists locate schools of fish?
Discovery of Sound in the Sea – How is sound used to locate fish?
NOAA Fisheries – Acoustic Echosounders–Essential Survey Equipment and Acoustic Hake Survey Methods on the West Coast
NOAA Ocean Service – Ocean Facts – What is sonar?
Science – Sounds like my favorite fish – killer whales differentiate salmon species by their sonar echoes
NOAA Fisheries – Sound Strategy: Hunting with the Southern Residents, Part 2
The Pew Charitable Trusts – Advanced Sonar Technology Helps NOAA Count Anchovy
