
(Note that sections of this post I have edited from my original post on the NOAA Teacher at Sea Alumni Association website)
This table captures the data I am using to generate my crocheted Stitch The Sky At Sea Project. I’ll be crocheting my sky color observations, while also listing NOAA’s sky cover data for the same location, for the entire month of June. The final product will include data from my home (Philadelphia, PA), where I had a one-day layover during my flights (Seattle, WA), and Alaska (my time in Kodiak waiting to sail, and data collected while at sea). Stitch along with me!
| June | Location | Sky color observed (by myself) | NOAA’s sky cover value | Notes |
| 1 | PHL | bright blue (Aurora) | 0.1 | At home, waiting to depart |
| 2 | PHL | bright blue (Aurora) | 0.2 | |
| 3 | SEA | bright blue (Aurora) | 0.1 | Departed Philly early AM, day in Seattle |
| 4 | Kodiak | dark gray (Nebula) | 1.0 | Arrived in Kodiak, stay in hotel |
| 5 | Kodiak | dark gray (Nebula) | 1.0 | |
| 6 | Kodiak | dark gray (Nebula) | 1.0 | |
| 7 | Kodiak | dark gray (Nebula) | 1.0 | |
| 8 | Kodiak | dark gray (Nebula) | 1.0 | |
| 9 | Kodiak | dark gray (Nebula) | 1.0 | |
| 10 | transit | white (Cumulus) | 0.9 | Departed Kodiak, in transit |
| 11 | transit | light gray (Nimbus) | 0.9 | transit/sheltering in Larsen Bay |
| 12 | transit | white (Cumulus) | 0.3 | transit started 5AM |
| 13 | transit | light gray (Nimbus) | 0.9 | *started using Cold Bay sky cover values |
| 14 | transit/arrival | dark gray (Nebula) | 1.0 | Arrive at first transect survey site (late PM) |
| 15 | transects | dark gray (Nebula) | 0.9 | |
| 16 | transects | light blue (Downpour) | 1.0 | |
| 17 | transects | bright blue (Aurora) | 0.4 | |
| 18 | transects | light gray (Nimbus) | 0.7 | |
| 19 | transects | dark gray (Nebula) | 0.9 | |
| 20 | transects | dark gray (Nebula) | 0.8 | |
| 21 | transit | dark gray (Nebula) | 1.0 | *back to using Kodiak sky cover values |
| 22 | Kodiak | dark gray (Nebula) | 1.0 | Flew out of Kodiak at 4PM, to Anchorage, then Seattle overnight |
| 23 | SEA | light blue (Downpour) | 0.3 | More travel, sky cover data for Seattle |
| 24 | PHL | dark gray (Nebula) | 0.9 | *back home! Looks like I brought the dark skies back home with me… |
| 25 | PHL | white (Cumulus) | 0.6 | |
| 26 | PHL | light gray (Nimbus) | 0.9 | |
| 27 | PHL | white (Cumulus) | 0.9 | |
| 28 | PHL | light blue (Downpour) | 0.6 | |
| 29 | PHL | light gray (Nimbus) | 0.6 | [Canadian wildfire smoke covering the region today 😦 ] |
| 30 | PHL | light gray (Nimbus) | 0.6 |
I love to visualize data through the creative arts. I’ve crocheted daily maximum temperature data to play-by-play analysis of a college football championship game. (Check out how you can crochet your own data and how to find data sets)
But it was after I quilted sky/cloud cover data from a recent oceanographic expedition that I shifted to thinking about not only documenting daily observations with yarn, but encouraging others to do the same and follow along! For the quilt that was the inspiration for this second phase of sky observations, see Blue skies and cloud cover at sea – via quilt.
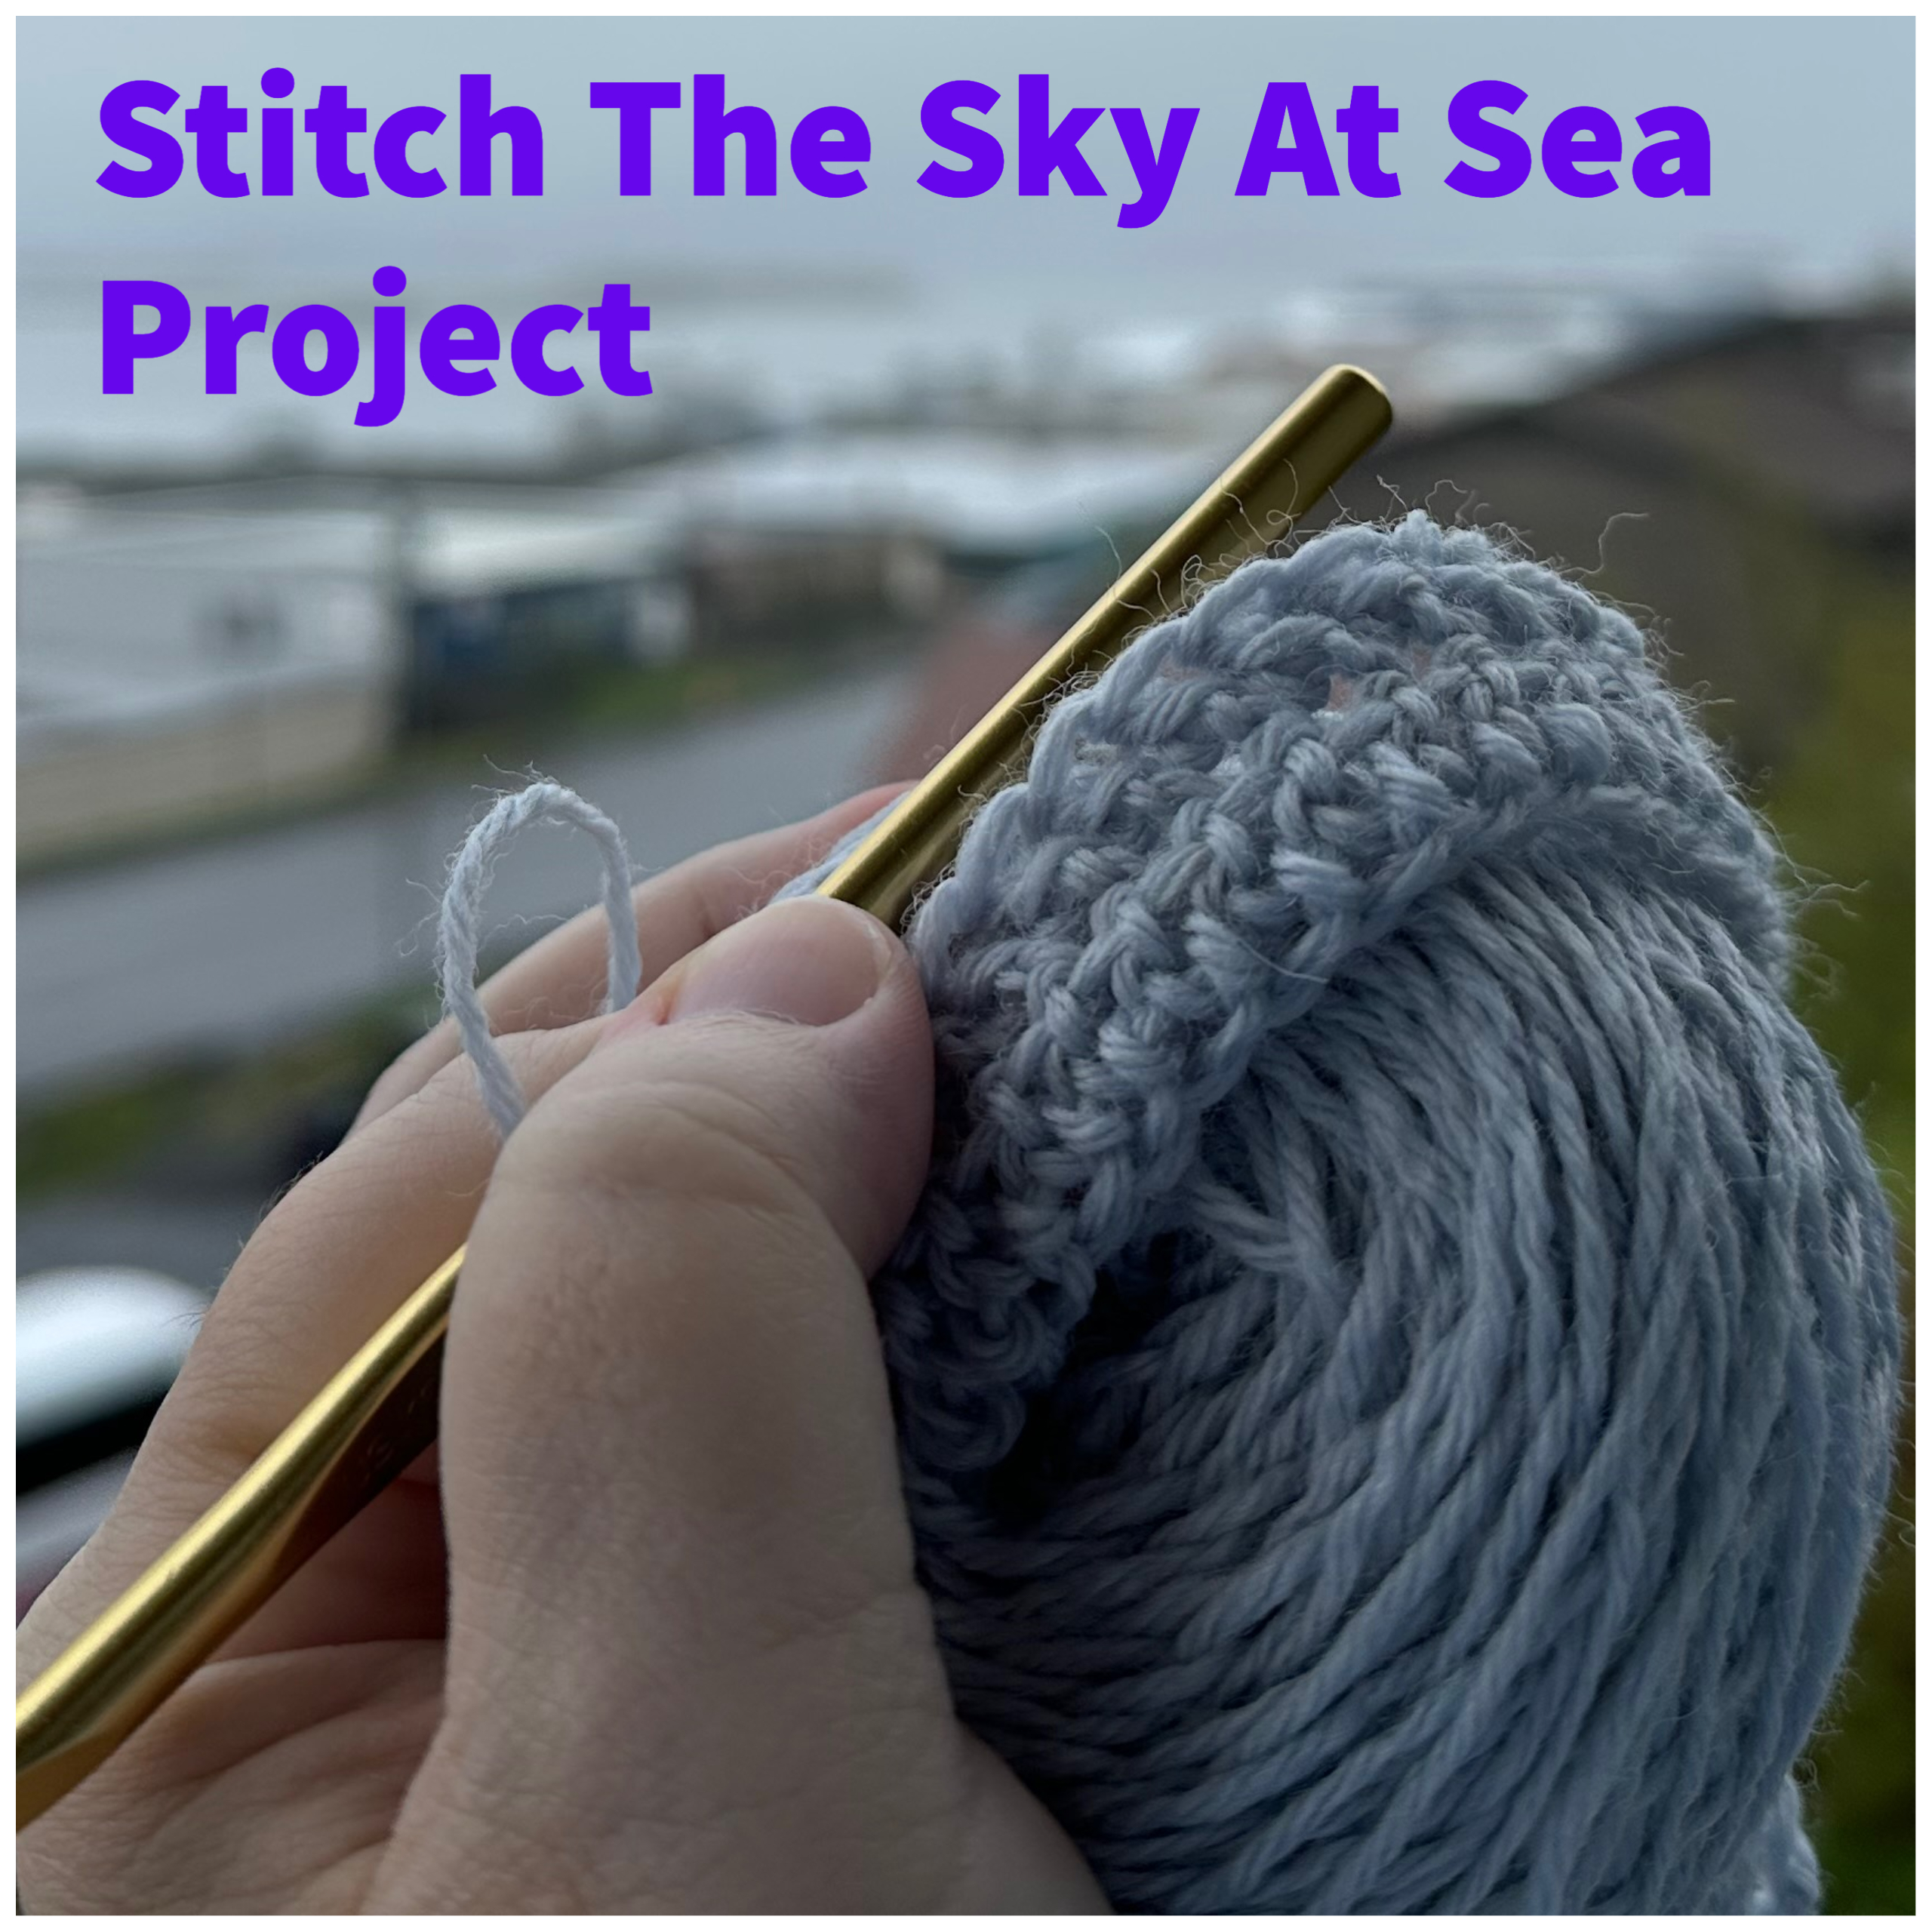
I am about to head out on NOAA Ship Oscar Dyson (June 2023) for the first leg of the Gulf of Alaska Walleye Pollock Acoustic Trawl Survey. I will be looking to the sky to record my observations in what I’m calling the Stitch the Sky At Sea Project.
I invite you to join me and make your own local atmospheric observations and “stitch” them with your favorite tool (knitting needle, crochet hook, embroidery needle, or if “stitching” isn’t your thing— colored felt strips, construction paper, drawing, or painting). Read on to learn how!
Stitch The Sky – Color Observations
My Stitch the Sky Project is based upon the Knit the Sky Scarf Project, which encourages individuals to look at the sky for one year and knit a row each day in a color of yarn that represents the color of that day’s sky. My plan is to make daily observations, ideally at the same time of day, and note the sky color. I’ll also take a photo, so I have a record of the observation. These daily observations will be uploaded into one post on my TAS blog that I’ll revisit and update each day while I’m at sea, and at the top of this blog post.
Then, I will crochet a row in the color of yarn I brought with me that most closely matches what I see. I won’t be out long enough to generate an entire scarf, but I’ll stitch several rows so that by the end, I’ll have a potholder, or mini table runner, or a small wall hanging—something fun that documents my observations.
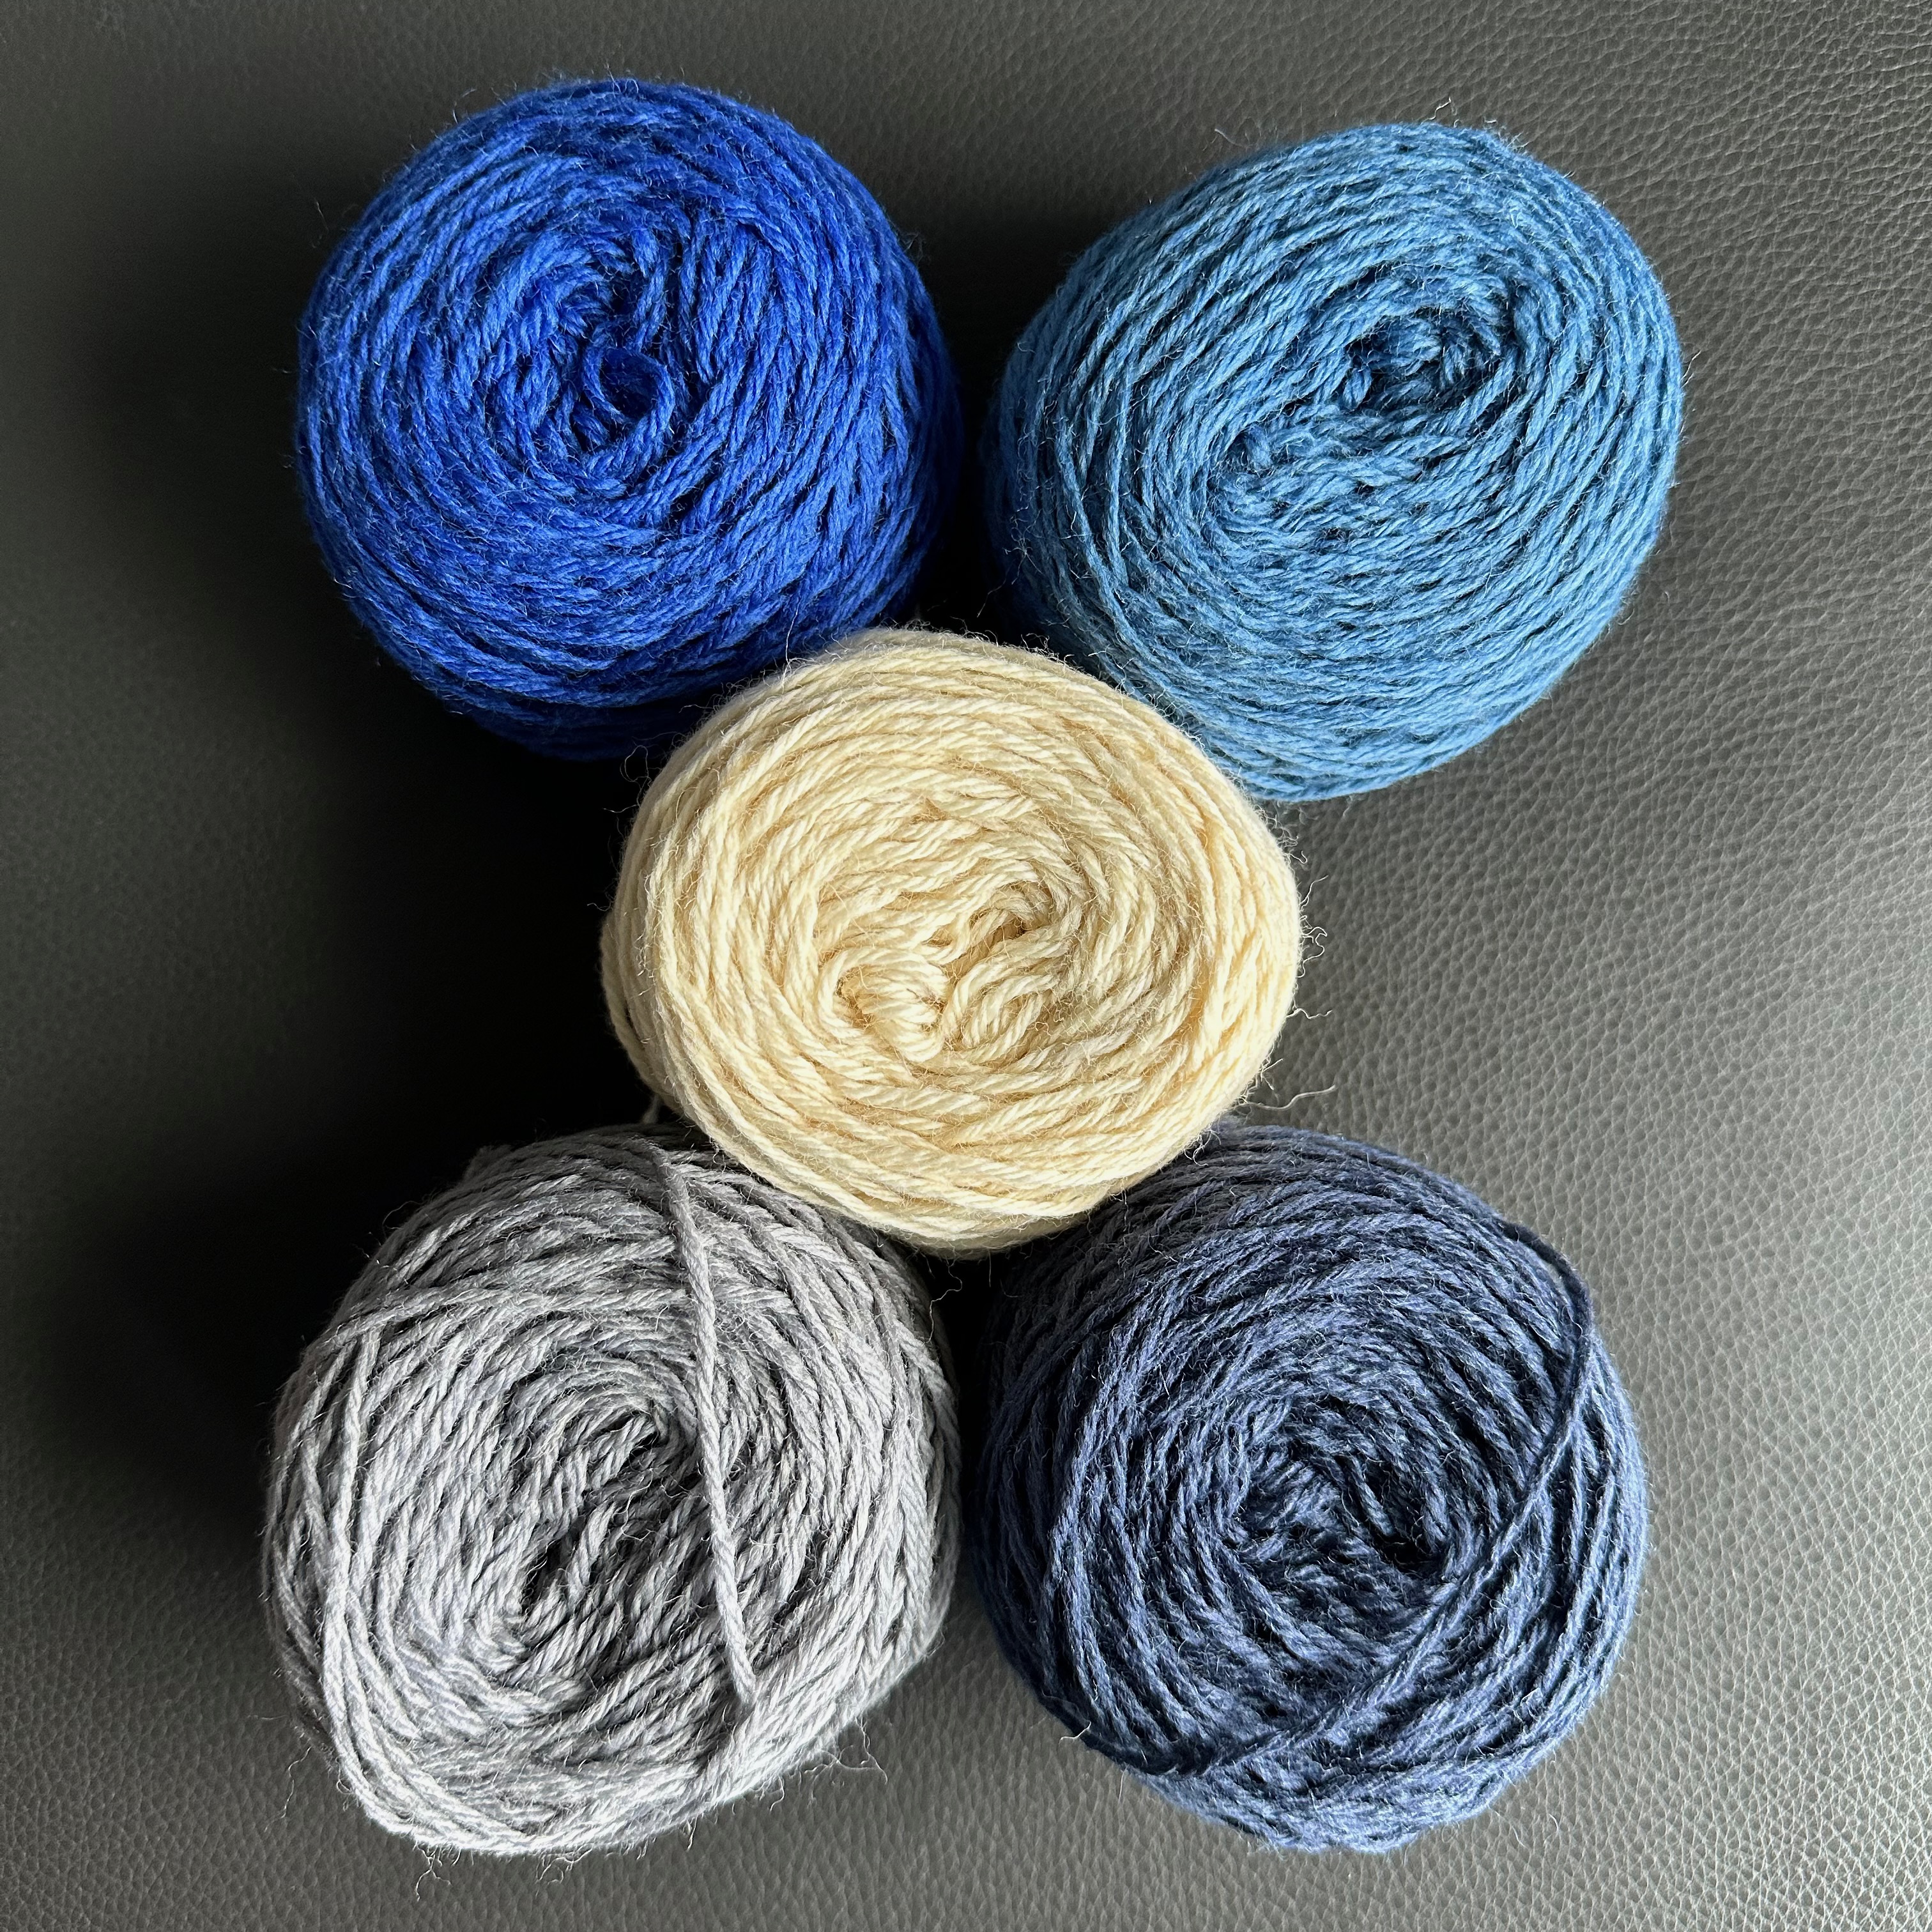
Which colors will I use? The Knit the Sky Scarf Project recommends picking five colors as the basis for the stitching. Strands of two different colors can be stitched together to provide additional color options. To represent the blue-to-gray skies I’ll observe, I am using the following yarn colors available from The Tempestry Project: Aurora (top left), Downpour (top right), Cumulus (middle), Nimbus (lower left), Nebula (lower right). I am a fan of these earthy colors, but any color combination can be used.
I hope others will follow along and stitch the sky color from their location during the same dates I’m at sea—it would be fun to compare our stitches when I return from the Gulf of Alaska!
Variations for Stitch The Sky At Sea
Recording the daily variations in the color of the sky is one way to make regular observations of our surroundings. In addition to making sky color observations, scientists also record a value called cloud cover, sometimes called cloud amount. This is defined as the fraction of the sky covered by cloud of any type or height above the ground. It is measured on the okta scale that starts at zero for a clear sky and extends to 8 for a sky that is completely overcast.
Another way to stitch quantitative measurements of sky cover is by diving into the National Weather Service (NWS) Climate Information portal. Here is an example of how I would do this. You can change the location to wherever is relevant for you.
- Go to https://www.weather.gov/wrh/climate
- Click on the state of Alaska (Be sure to click on the lower portion, the Anchorage region). [See Figure 1]
- On the next page, select the tab “Observed Weather” > “Daily Climate Report (CLI)” > then the location “Kodiak” (as my ship is departing from Kodiak Island). [See Figure 2]
- A table then appears at the bottom of the page listing SKY COVER for the previous day. NWS reports this average value in tenths on a scale of 0.0 to 1.0. On this scale, 0.0 indicates a clear sky and 1.0 (or 10/10) indicates a completely covered sky. I can also go back to previous dates to see what the Sky Cover values were, in addition to weather data. [See Figure 3]


So much data! So many options to pursue! As I want to make sure I spend some time looking at my surroundings, I’ll be using my own observations of the color of the sky each day for my stitching project. If you are doing this project with students, you could have them go out and observe their local sky cover and then go inside and look up what the National Weather Service has recorded. There are a lot of options here!
In the end
By sharing this project, I hope that others will join me as participants and will become active observers in the world around them and learn more about the atmosphere and overall Earth systems. When I return from my time at sea, I look forward to sharing my work with new, non-STEM audiences (like stitching groups) that do not typically engage with science information or ocean exploration. Three cheers for promoting ocean and science literacy where you least expect it!
If there are any questions about the Stitch the Sky At Sea Project, or if you have stitching you would like to share, please do not hesitate to contact me (guertin@psu.edu)!
